
Own the market’s gains. Decide in advance the most you can lose.
You choose the floor. Below it, your losses stop — no cap on the upside unless you ask for one, no policy to apply for, settled from your own account — whether that is cash you are investing or shares you already hold.
We buy shares in the index you choose — the S&P 500 or the Nasdaq 100 — and they sit in your own account, in your own name. You own them and you collect the dividends. Then we place the protection around those shares, so it is in place from the first day.
We don’t touch the shares you have. You keep them and you keep the dividends, and because nothing is sold, the gains you’ve been carrying keep deferring. We simply place the protection around what you already hold.
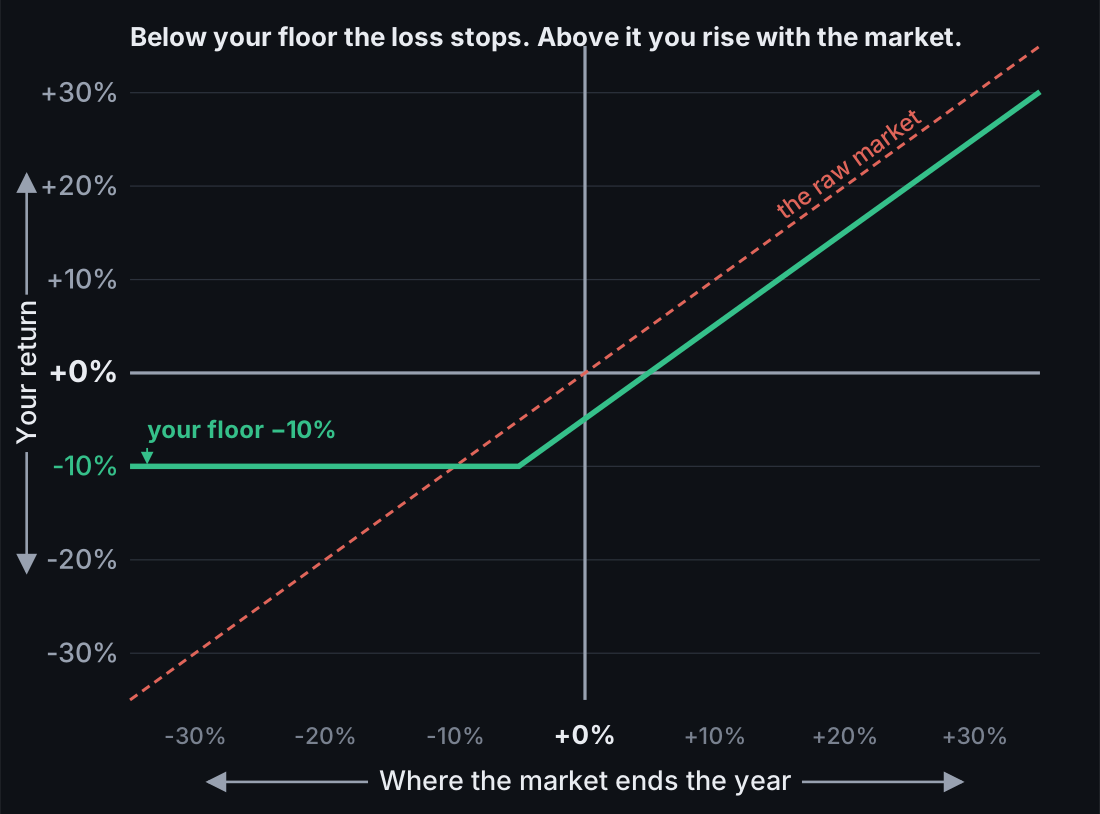
A hard floor underneath you, and no ceiling above it unless you ask for a cap. We buy the protection at the start of the term with cash already in your account — nothing for you to send, buy or sign. Your payoff begins once the market is up a little, because some of your money bought the protection, so the first part of any rise replaces that capital. After that, the gains are yours. That starting point is fixed for your term once we buy the protection. What changes day by day is the quote for a new purchase, so please use our calculator to see today’s price for the product and term you choose. Your worst case, measured at the end of the term, is designed to stop at the floor you choose. Here it is at its −10% level, the tightest floor in the lineup.
This is a true worst case, with the protection already built in. There is nothing further to subtract. The dashed line is the market on its own.
What the protection actually is, what it covers, and what it asks of you — without the jargon.
A small piece of the money already in your account — usually a few percent — buys an option, and that one option covers the whole account for the term you choose. In return, the first part of any rise replaces the money that bought it — after that, the gains are yours.
Like insuring a house against a fire that may never come. Your losses stop where you chose — however far the market falls.
The protection covers your whole balance. It is bought outright in the open market and held in your name.
You see the whole shape of the outcome before anything is placed: your floor, where your gains start, and how long it runs. Once we are in, none of it moves.
No cap unless you choose one. In a strong year there is no ceiling on what a rise is worth to you. In a bad year, that protection is what saves you.
Priced against real market prices and real option prices from 2007 to 2025. These are hypothetical figures, not an actual account. The market plunges, your floor stops the loss, and when the market climbs back you climb with it.
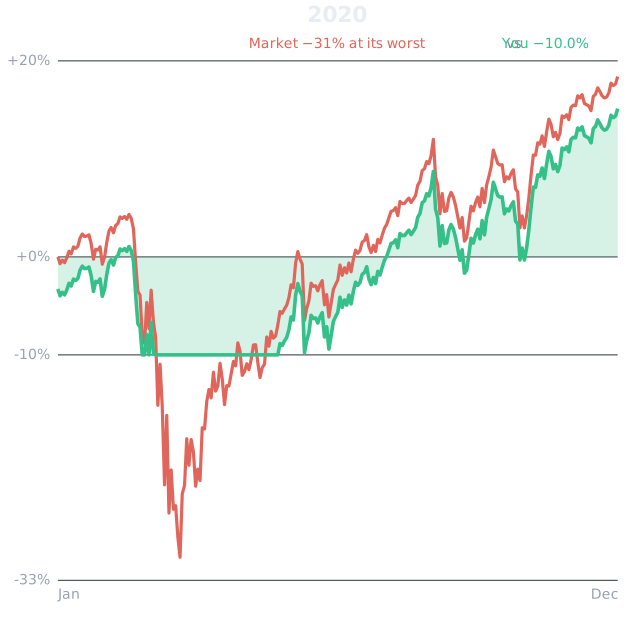
The market fell ~31% in five weeks, then finished the year +18.4% including dividends (real daily data). Your −10% floor stopped the loss; with no cap on it, you kept the full recovery, ending the year at +15.1%.
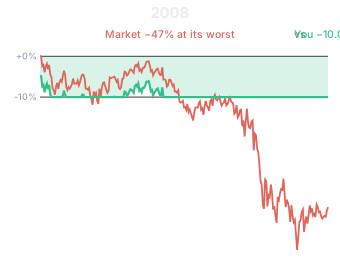
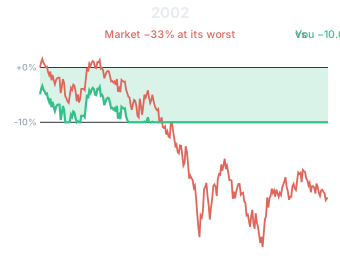
The 2008 and 2002 panels use real daily S&P 500 data and real option prices. Benchmarks are shown at their calendar-year close, which is the basis used throughout this site. Inside 2008, the market’s worst point was about −47%.
Grow with the market. Relax through the crash.
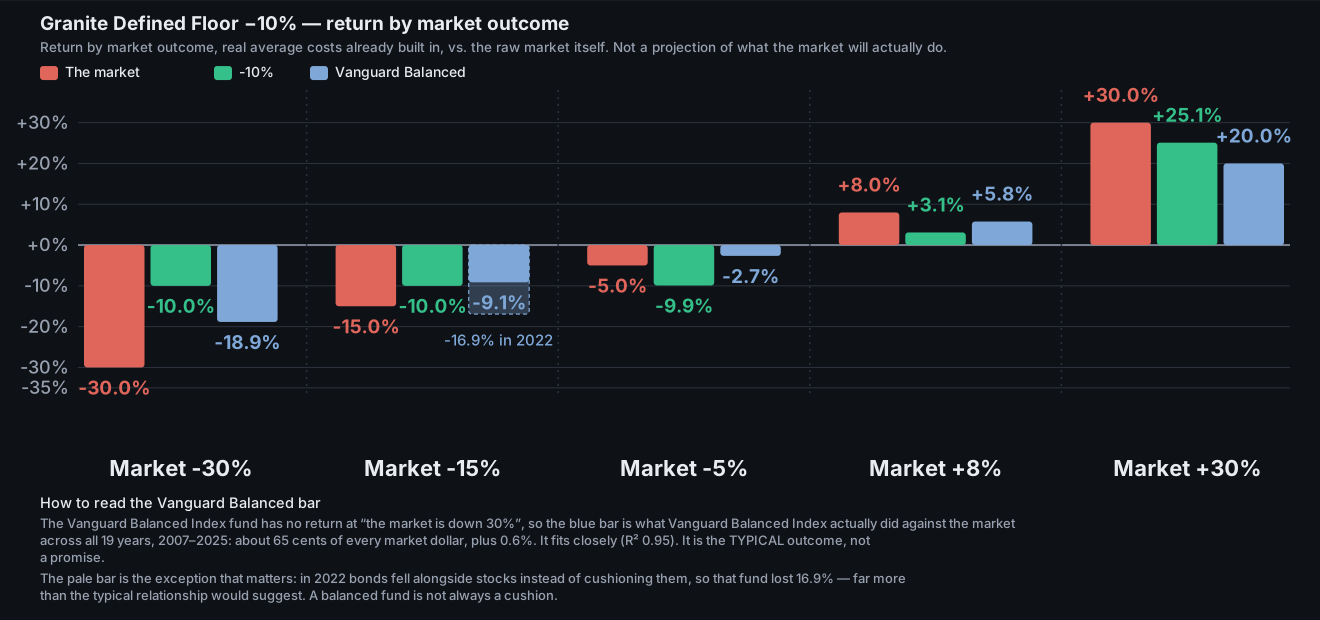
The same five market outcomes, priced from the point where this floor’s payoff really begins.
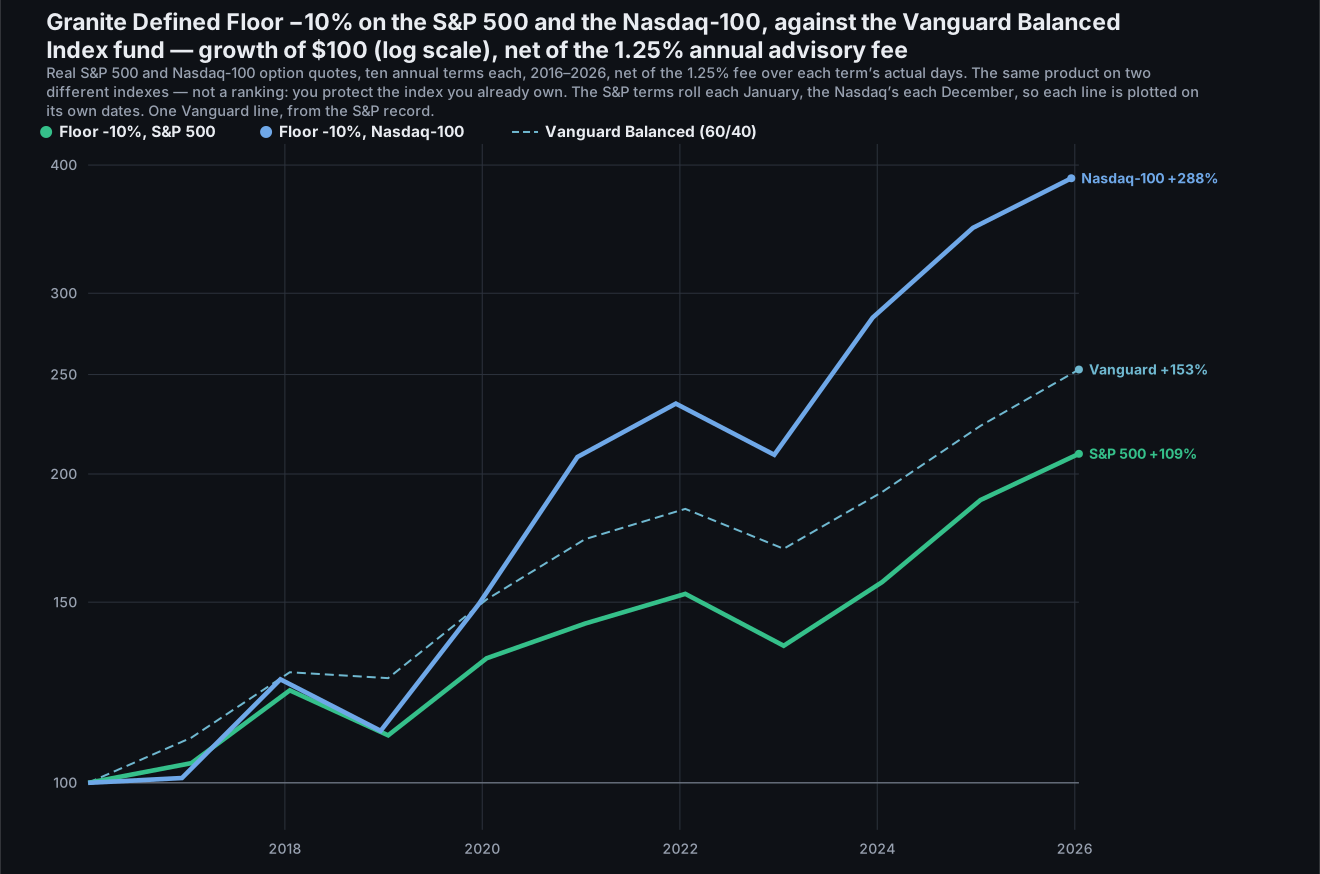
CAGR means compound annual growth rate. It is measured over our published ten-year window: ten annual terms, rolled each January, 2016–2026. All three figures are net of our 1.25% advisory fee, charged over each term’s actual days. Each figure is an average of the twelve start-month ladders’ own growth rates, and all three are worked out the same way, so they can be compared directly. The S&P 500 and Vanguard figures are total returns, with dividends and distributions reinvested. They are taken from the real tracking funds, never from an assumed yield. This window opens in 2016 and therefore does not contain the 2008 crash — the kind of period a floor is built for. It does contain the 2020 COVID crash and the 2022 bear market. We show the 2008 and 2002 panels above precisely because the growth figures here miss them. These are hypothetical, backtested figures, priced on real S&P 500 option prices throughout. They are not actual accounts.
Market returns only count if you don't sell. We make sure you don't.
Everything you just saw at −10% works exactly the same way at −15% or −20%. Only two things change: the floor level, and where your payoff begins. A deeper floor lets your payoff begin sooner and tracks the market more closely. A tighter floor starts your payoff a little later and keeps your worst case smaller.
Where your payoff begins is priced to the market on the day, and it is different every term, so we quote no figure here. Please use our calculator to see today’s price for the product and term you choose. Once your protection is bought, that starting point is fixed for the term. The floor itself never moves either.
Each floor is a true worst case. The point where your payoff begins is already built in.
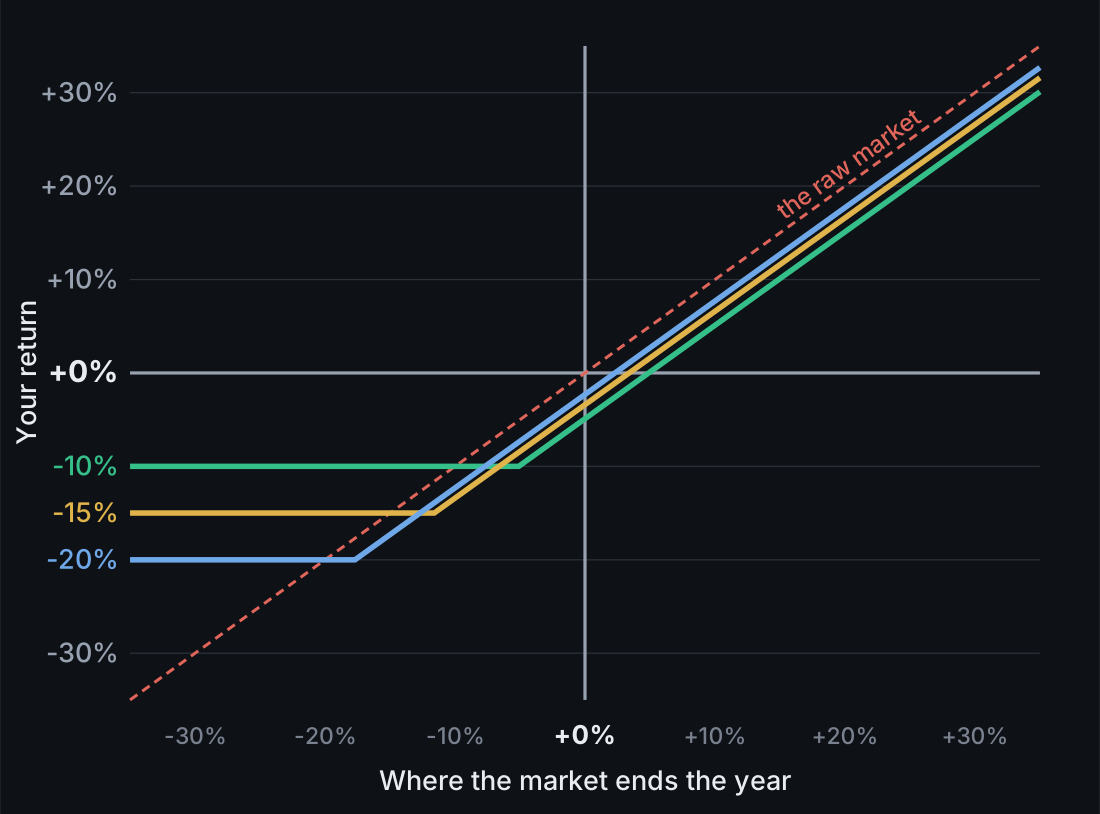
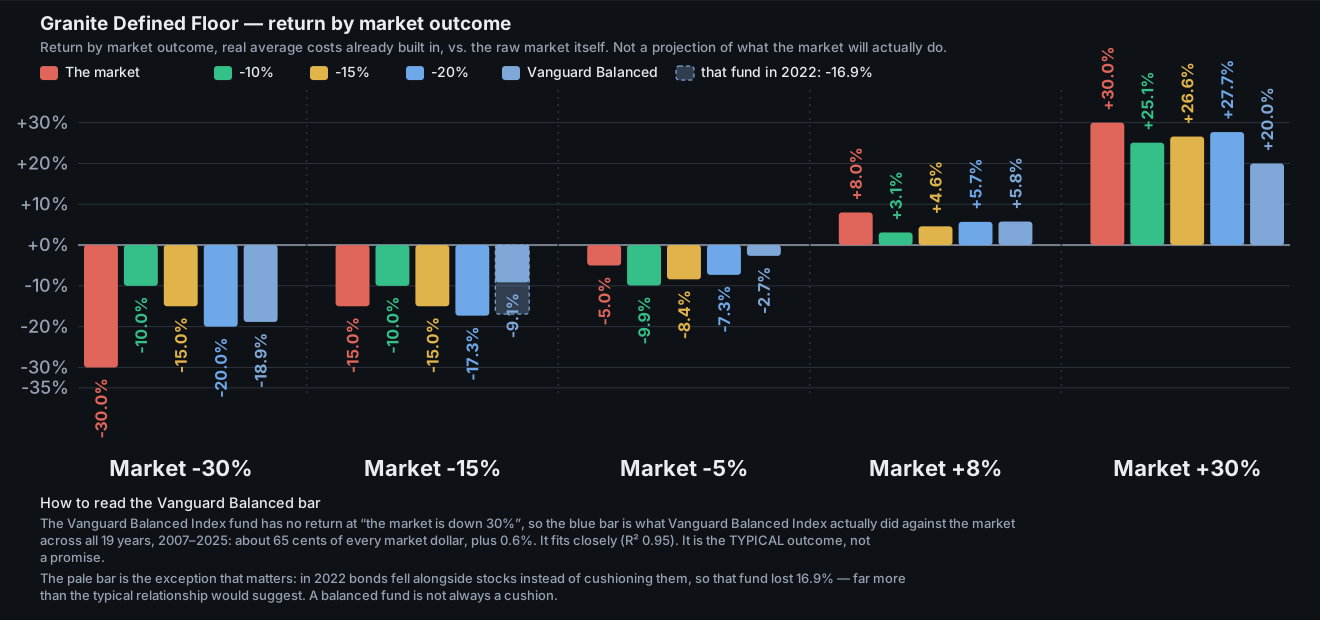
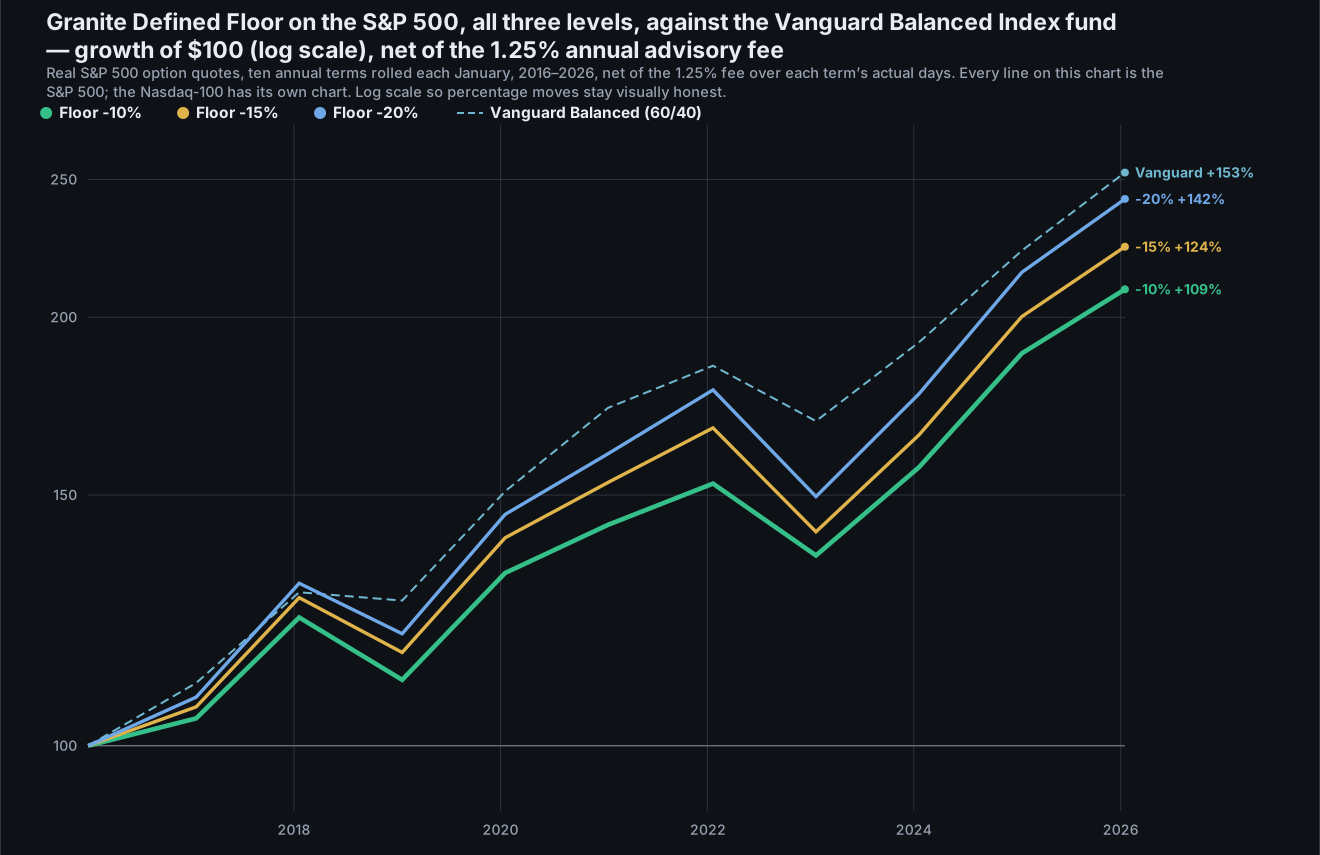
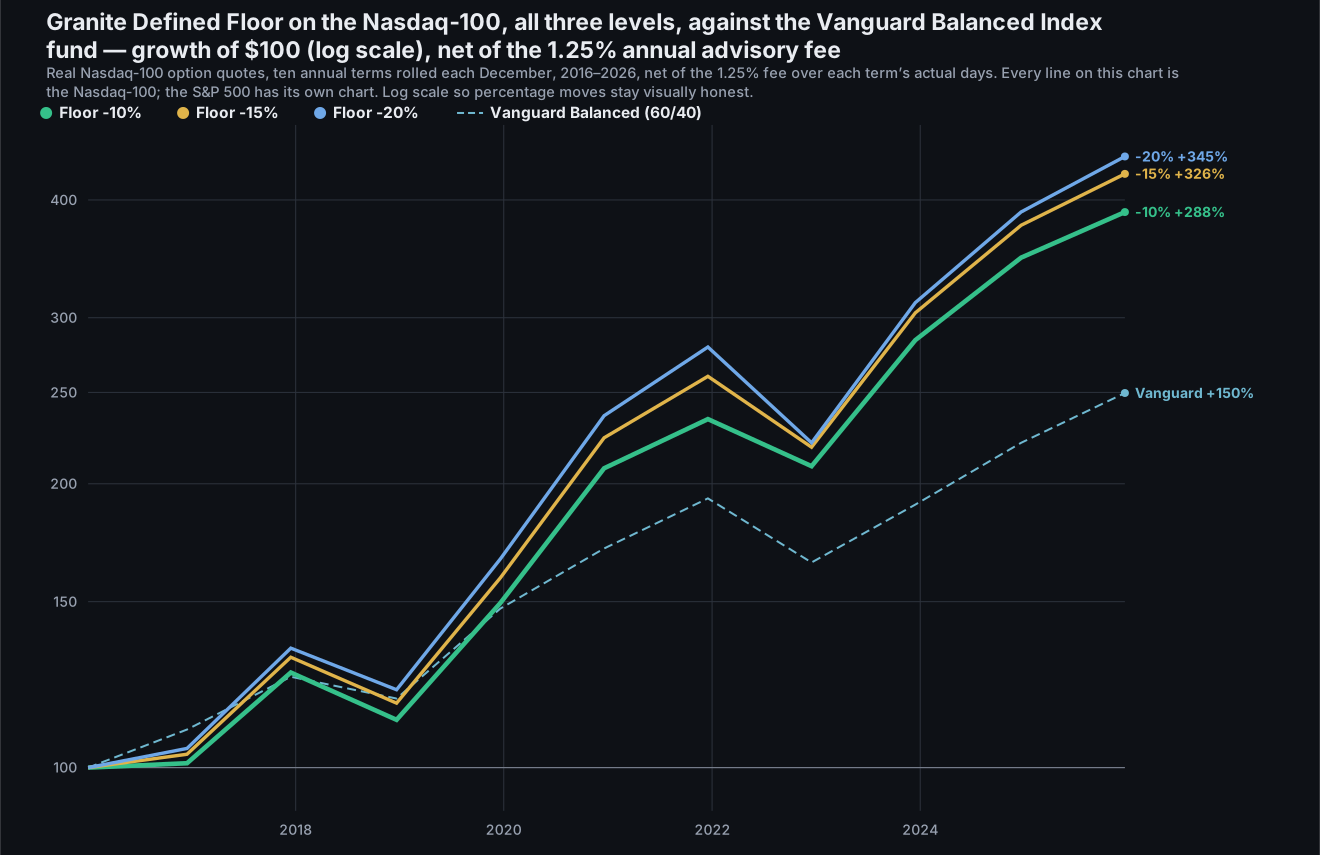
The level you choose — −10%, −15% or −20% — never moves once your options are in place, and neither does where your payoff begins. Both are set the day we buy, and both hold for the whole term. What changes is the next purchase. A new term is priced the way insurance is priced, to the conditions at the time. When markets are jittery your payoff begins a little further up. When markets are calm it begins sooner. Either way, you settle it by giving up the first part of any rise, never out of your own pocket, and there is nothing for you to do.
The figures on this page are averages from a backtest across a full market cycle, taken from real option prices rather than from a formula. Any single term’s exact starting point is set the day we buy, and it can run a little above or below that average. One thing never changes: your worst case for the term is locked the moment we place the trade, before the market has a chance to move against you.
Each small graph shows what one piece is worth at the end of the term. The horizontal axis is the gain or loss on the index; the vertical axis is the gain or loss in your account from that piece. The letter “B” stands for the top of the band — it is not a fixed number; the market sets it on the day we buy. The example uses a −10% dial.
What it is for: this is your actual investment. Everything below is shaped around it, never instead of it.
What it is for: the put is an insurance contract on your shares. Below −10% its gains cancel the shares’ losses point for point, so the account stops falling. The catch: the put has a price. Paid in cash, the protection would cost you money up front. Step 2 pays for it another way.
What it is for: the sold call brings in cash — enough to pay for the put in Step 1. On its own it would hand over all the upside, so the bought call at B is added to switch it off: above B the two cancel exactly. What is left is a fixed-size giveaway — the band from −10% up to B — and nothing else. Why B moves: B is placed wherever the band’s cash exactly covers the put’s price that day. When protection is expensive, B sits higher and the band is wider; when it is cheap, B sits lower. So you never spend cash on protection; you trade a slice of the recovery for it instead.
Read it: below −10% you are ahead of the market. Between −10% and B you get the floor, not the recovery — that slice was the price. Above B you keep every dollar of every rise, permanently the band’s width behind the market. No cash left your account to buy any of it.
All four option legs are on the index itself, settle in cash, and share one expiry. Each small graph is the picture at expiry and ignores what the leg cost or earned — the band is sized so those balance.
Move the dial, see your exact return at every level of the market, before you invest a dollar. This is the same live calculator as our Design Your Outcome page.
Growth means nothing if you can’t stay for the ride.
The Floor is built for a client whose first question is “how much can I lose?” It answers that with a number you choose. What it asks in return is that you accept finishing a little behind an unprotected account in the good years.
The floor is measured by where you finish the term, not by every day inside it. Figures shown are net of our 1.25% advisory fee, charged over each term’s actual days. These are real listed options, held in your own account and in your own name. Options involve risk and are not suitable for every investor.
A Floor is a hard stop. It wins the rare, deep crash, because your loss is designed to stop at the floor you chose. A Buffer is a soft cushion. It wins the frequent, mild dip, because its payoff begins sooner and it tracks closer to the market. But it does not stop your loss, so in a deep crash your losses carry on below it. The Buffer wins often, in small amounts. The Floor wins rarely, in large ones.
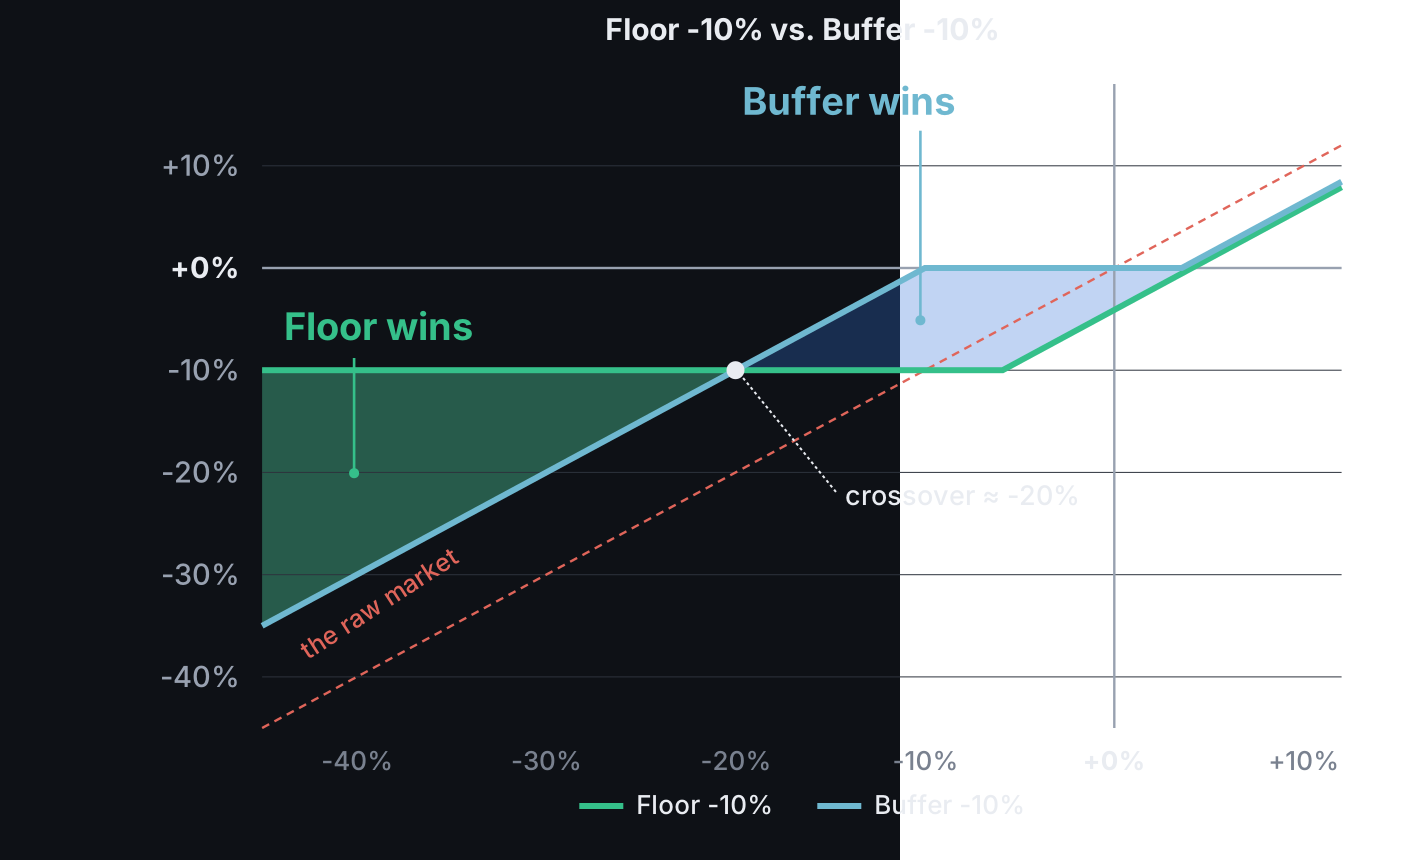
These are illustrative payoff diagrams, built from the real point at which each level’s payoff begins. They are not a projection of what the market will actually do.
Tell us the floor you’d be comfortable with and we’ll build it around your account, at the size and date you choose.
Schedule an introductory call